

The best Grafana alternative depends on what is actually bothering you. SigNoz replaces the whole Loki, Grafana, Tempo, Mimir stack with one open source binary. Netdata skips configuration almost entirely. New Relic gives you 100GB of free data every month with no card on file. None of them are automatically cheaper than Grafana, and the math further down shows why.
Quick answer:
SigNoz for teams whose real complaint is running four separate LGTM components instead of one. Free self hosted, or $49 a month on SigNoz Cloud.
Netdata for near zero setup. Free for up to 5 nodes, then a flat $4.50 per node per month.
New Relic for a small team that is not ready to self host anything. 100GB of ingest included every month, indefinitely.
Why people start looking for a way out
Grafana did not start as a four piece stack. It started as one tool that drew clean graphs from a Prometheus database. Over the years it grew into the LGTM stack: Loki for logs, Tempo for traces, Mimir for metrics at scale, Grafana on top for dashboards. Running all four means four things to patch, plus three separate query languages, PromQL, LogQL, and TraceQL, that do not share syntax.
That frustration is not just something competitors say to sell against Grafana. A Hacker News thread titled "What happened to Grafana quality? Good alternatives?" picked up 3 points and a direct reply from Grafana co-founder Torkel Ödegaard, who wrote that Grafana "like most software is not immune to bloat over time" and asked the original poster for specifics so the team could look into fixing them. A founder answering in public is one of the more honest signals you will find on this topic, whichever side of the complaint you land on.
There is a second, more concrete reason teams look elsewhere. Grafana OnCall's open source edition went into maintenance mode in March 2025, and the repository was archived on March 24, 2026, with Grafana pointing self-hosted users toward the paid Grafana Cloud IRM product instead. If your team relied on free on call routing through Grafana, that door is closing.
The self-hosting math nobody puts in the marketing deck
Every "free and open source" tool on this list still needs someone to run the servers. A small ClickHouse cluster for self-hosted SigNoz, or a small Elasticsearch cluster for self-hosted Elastic, needs compute, storage, and a person who keeps it patched. Budget a few hours a month of engineer time on top of hosting costs, even when the license is free. That is not a knock on open source, just the part the pricing page leaves out.
What Grafana Cloud actually charges
Grafana Cloud's Free plan includes 10,000 active metric series, 50GB a month of logs, traces, and profiles, and 3 active dashboard users, all on 14 day retention. Once you outgrow that, Pro adds a $19 monthly platform fee plus usage: $8 per active Grafana user, $6.50 per 1,000 metric series over the free tier, and logs billed across three separate meters (process, write, and retain) that stack to roughly $0.55 per GB before volume discounts. It reads more complicated than it costs at small scale, which is the point of the math below.
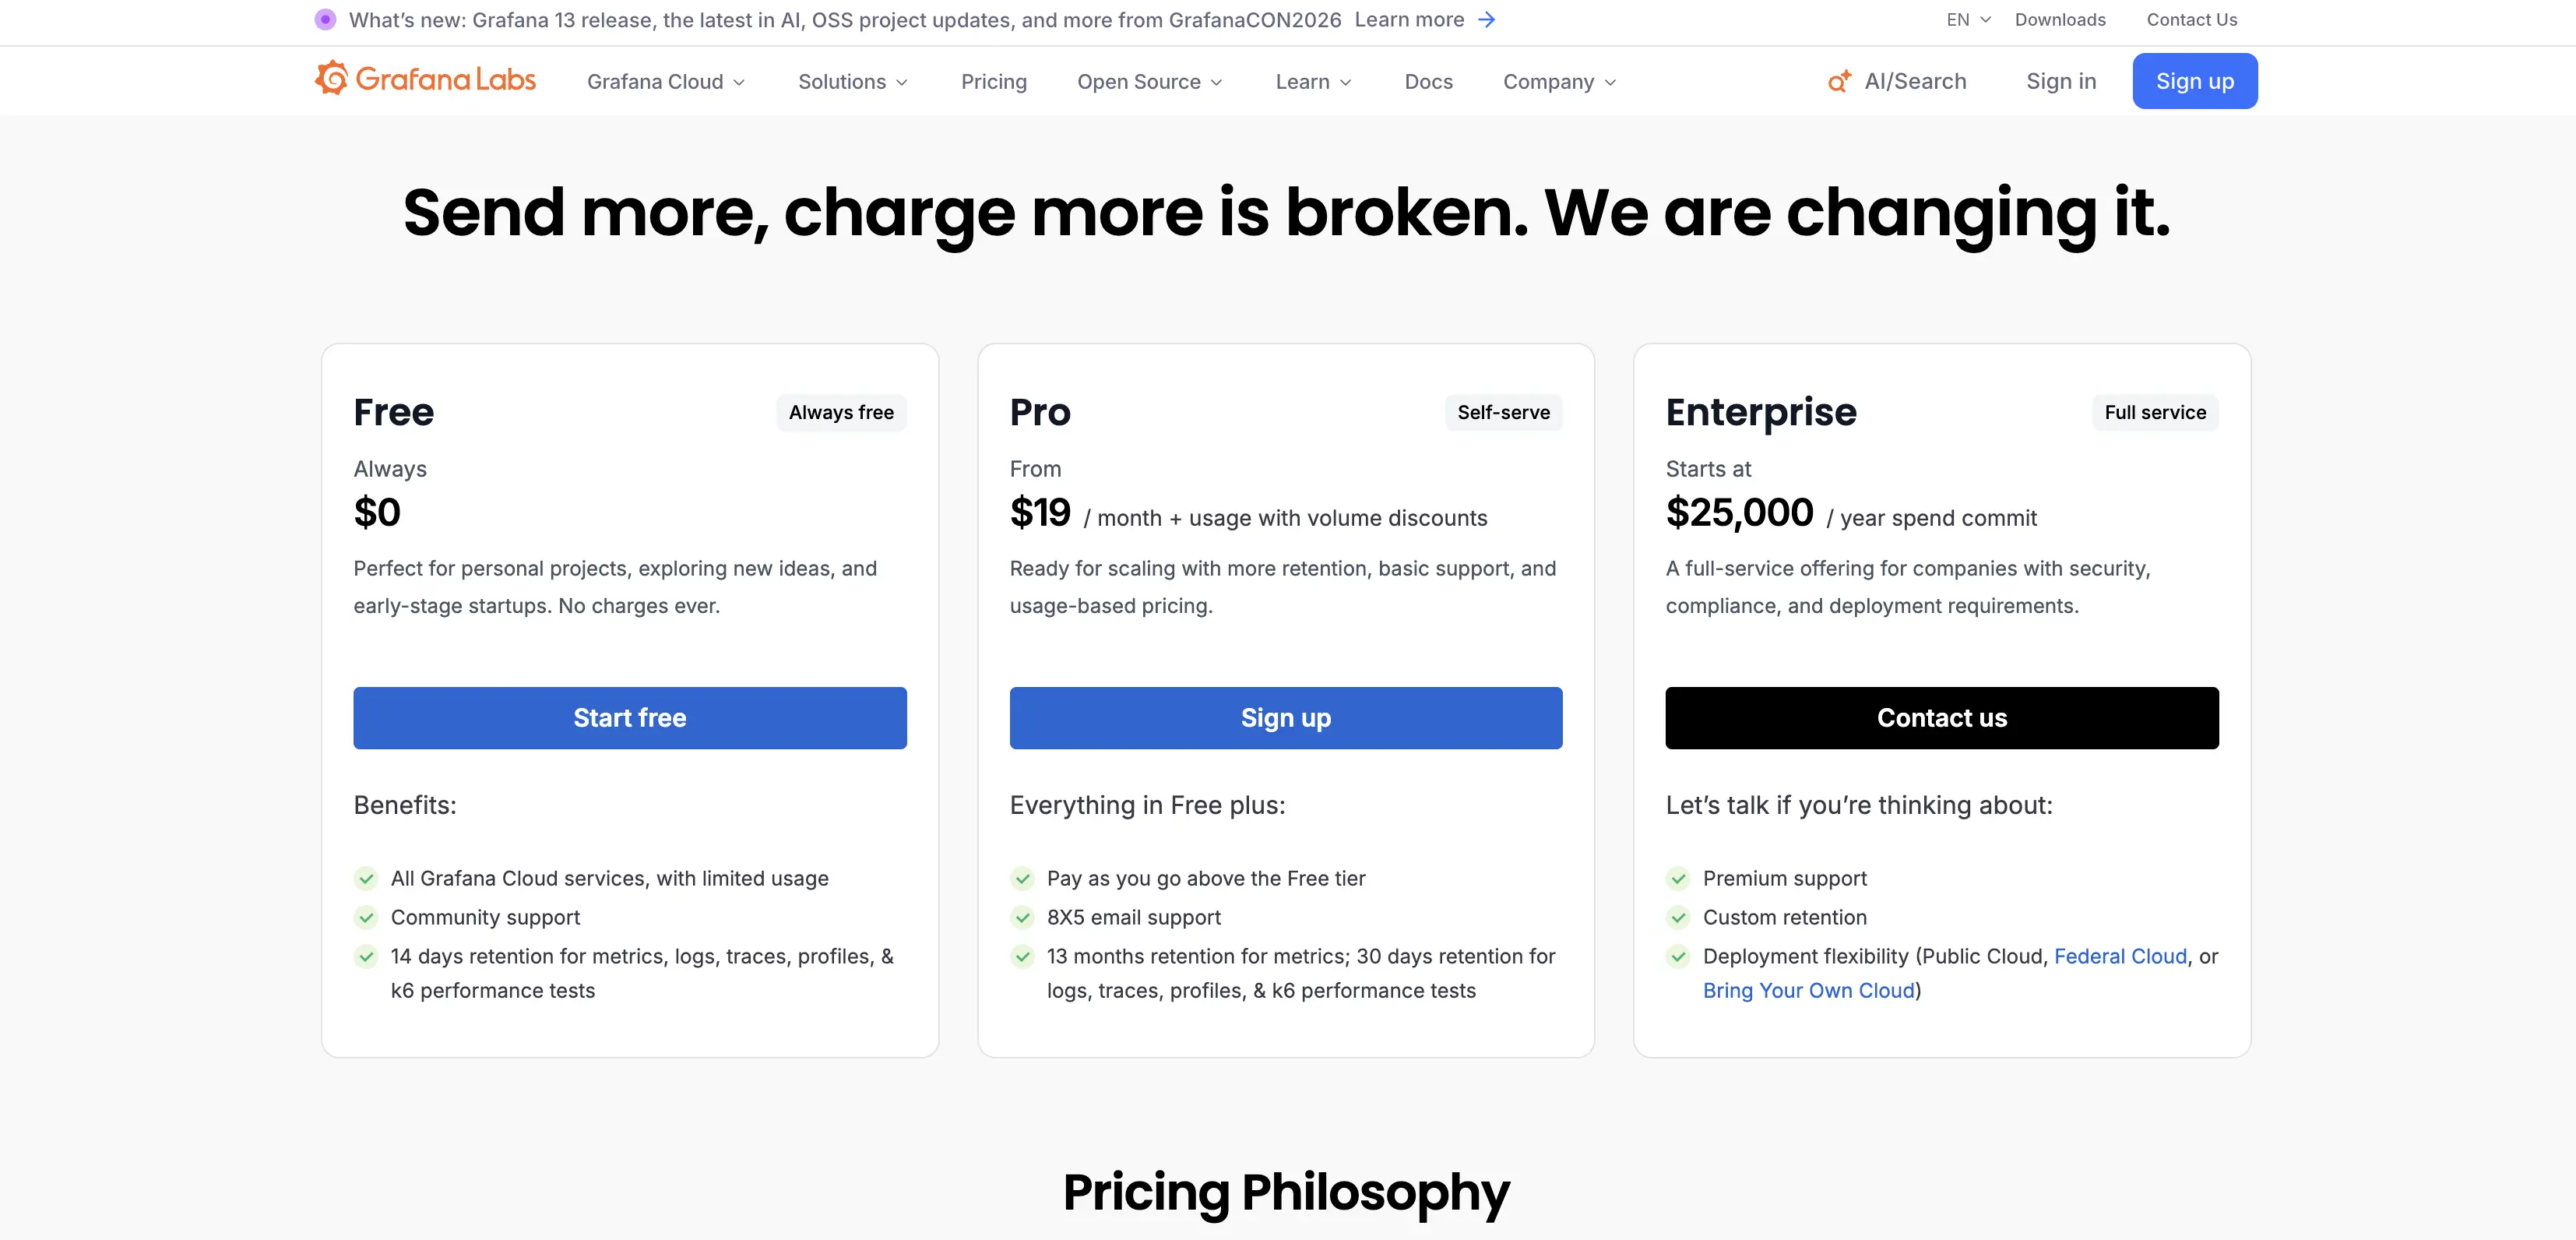 Here is the calculation nobody in the alternatives roundups seems to have run: at a normal Prometheus scrape interval of 30 seconds, a team sending 15,000 metric series generates about 1.3 billion samples a month. On Grafana Cloud Pro, that is 10,000 series free plus 5,000 series over, at $6.50 per 1,000, plus the $19 platform fee, for roughly $51.50 a month with a small team inside the free user allowance.
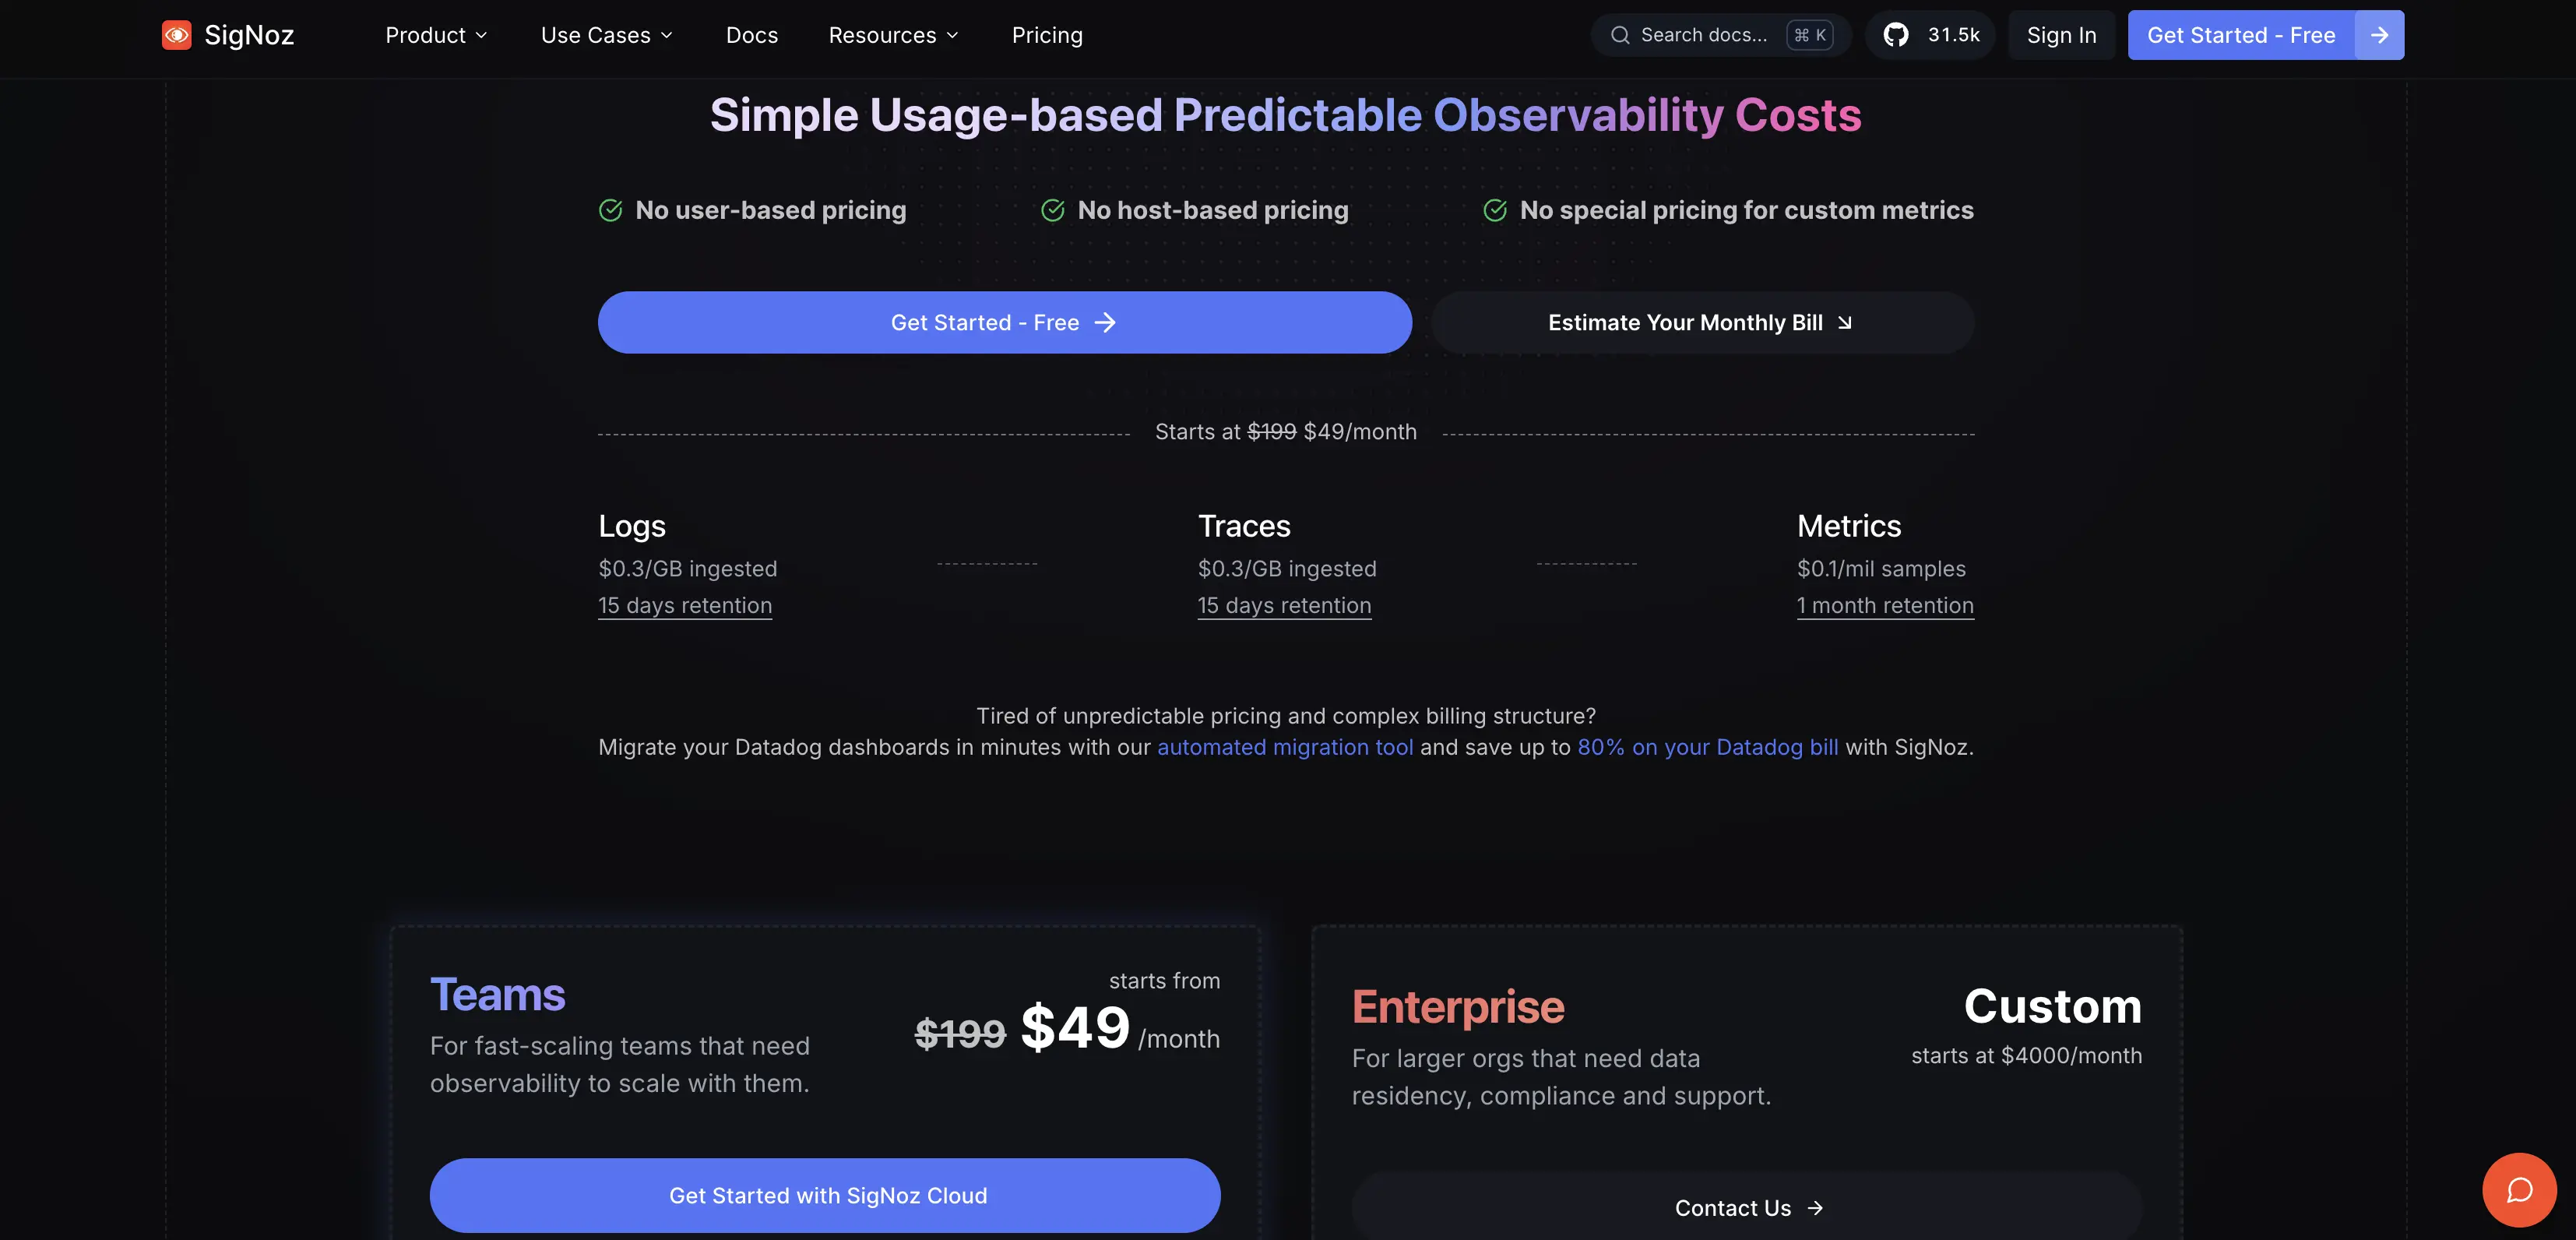
On SigNoz Cloud's Teams plan, the same 15,000 series burns through the $49 tier's included 490 million samples in about 11 hours, and the remaining 806 million samples cost $0.10 per million, pushing the total to roughly $129.60 a month for metrics alone. At that specific workload, Grafana is the cheaper option, the opposite of what most of these roundups claim.
Grafana Alternatives Explained
Open source and self-hosted first
SigNoz: Free self hosted, Cloud Teams $49/month plus usage, Apache 2.0 and MIT licensed. SigNoz is an open source observability platform that puts logs, metrics, and traces in one ClickHouse-backed tool instead of four separate Grafana components. Self hosting the Community edition is free with no data cap, which is the main reason it tops most of these lists. On SigNoz Cloud, run the numbers for your own series count before assuming it is the cheaper path; the math above shows it is not always true.
Elastic (Elasticsearch and Kibana): Free to self host, Elastic Cloud Hosted from $99/month. Elastic is the open source search and analytics engine behind Kibana's dashboards, and it can absorb logs, metrics, and traces much like Grafana's LGTM stack does. The core software is free under Elastic's dual license, and Elastic Cloud Hosted starts at $99 a month for the Standard tier before RAM, storage, and zone charges scale it up. Teams already running Elasticsearch for search often add Kibana dashboards for free instead of standing up a second tool.
Zabbix: Free and open source, paid support optional. Zabbix is a free, open source infrastructure and network monitoring tool that has been doing agent based server and device checks since long before Prometheus existed. There is no per node or per GB charge on the core software, only optional paid support and a separately priced Zabbix Cloud SaaS option. It fits classic infrastructure monitoring well, and modern high cardinality microservice traces less so.
Netdata: Free for up to 5 nodes, Business plan $4.50/node/month (billed annually). Netdata is a real time infrastructure monitoring tool that installs one agent per server and starts graphing in under a minute, with no dashboard building required first. The free Community tier covers up to 5 nodes, and the Business plan is a flat $4.50 per node per month with unlimited metrics, logs, and retention included, no separate per GB meter to track. For a small team that wants monitoring working today instead of configured over a week, it is the fastest path on this list.
OpenObserve: Self hosted free forever, Cloud $0.50/GB ingested plus $0.01/GB queried. OpenObserve is a single binary observability platform for logs, metrics, and traces, built on object storage instead of a database cluster. The open source edition stays free to self host with no cap, but OpenObserve discontinued its free Cloud tier in June 2025, so the hosted version now bills from the first gigabyte. Unlimited users are included on every Cloud plan, with no per seat fee to budget around.
Parseable: Cloud Pro from $0.39/GB, object storage based, bring your own cloud available. Parseable is a log and observability platform that stores data directly in object storage such as S3 buckets rather than a traditional index, which keeps per GB costs down at scale. Its Pro plan runs $0.39 per GB, with bring your own cloud deployment available for teams that need data to stay inside their own account. It leans toward log heavy workloads more than dashboard first visualization.
Commercial and all-in-one
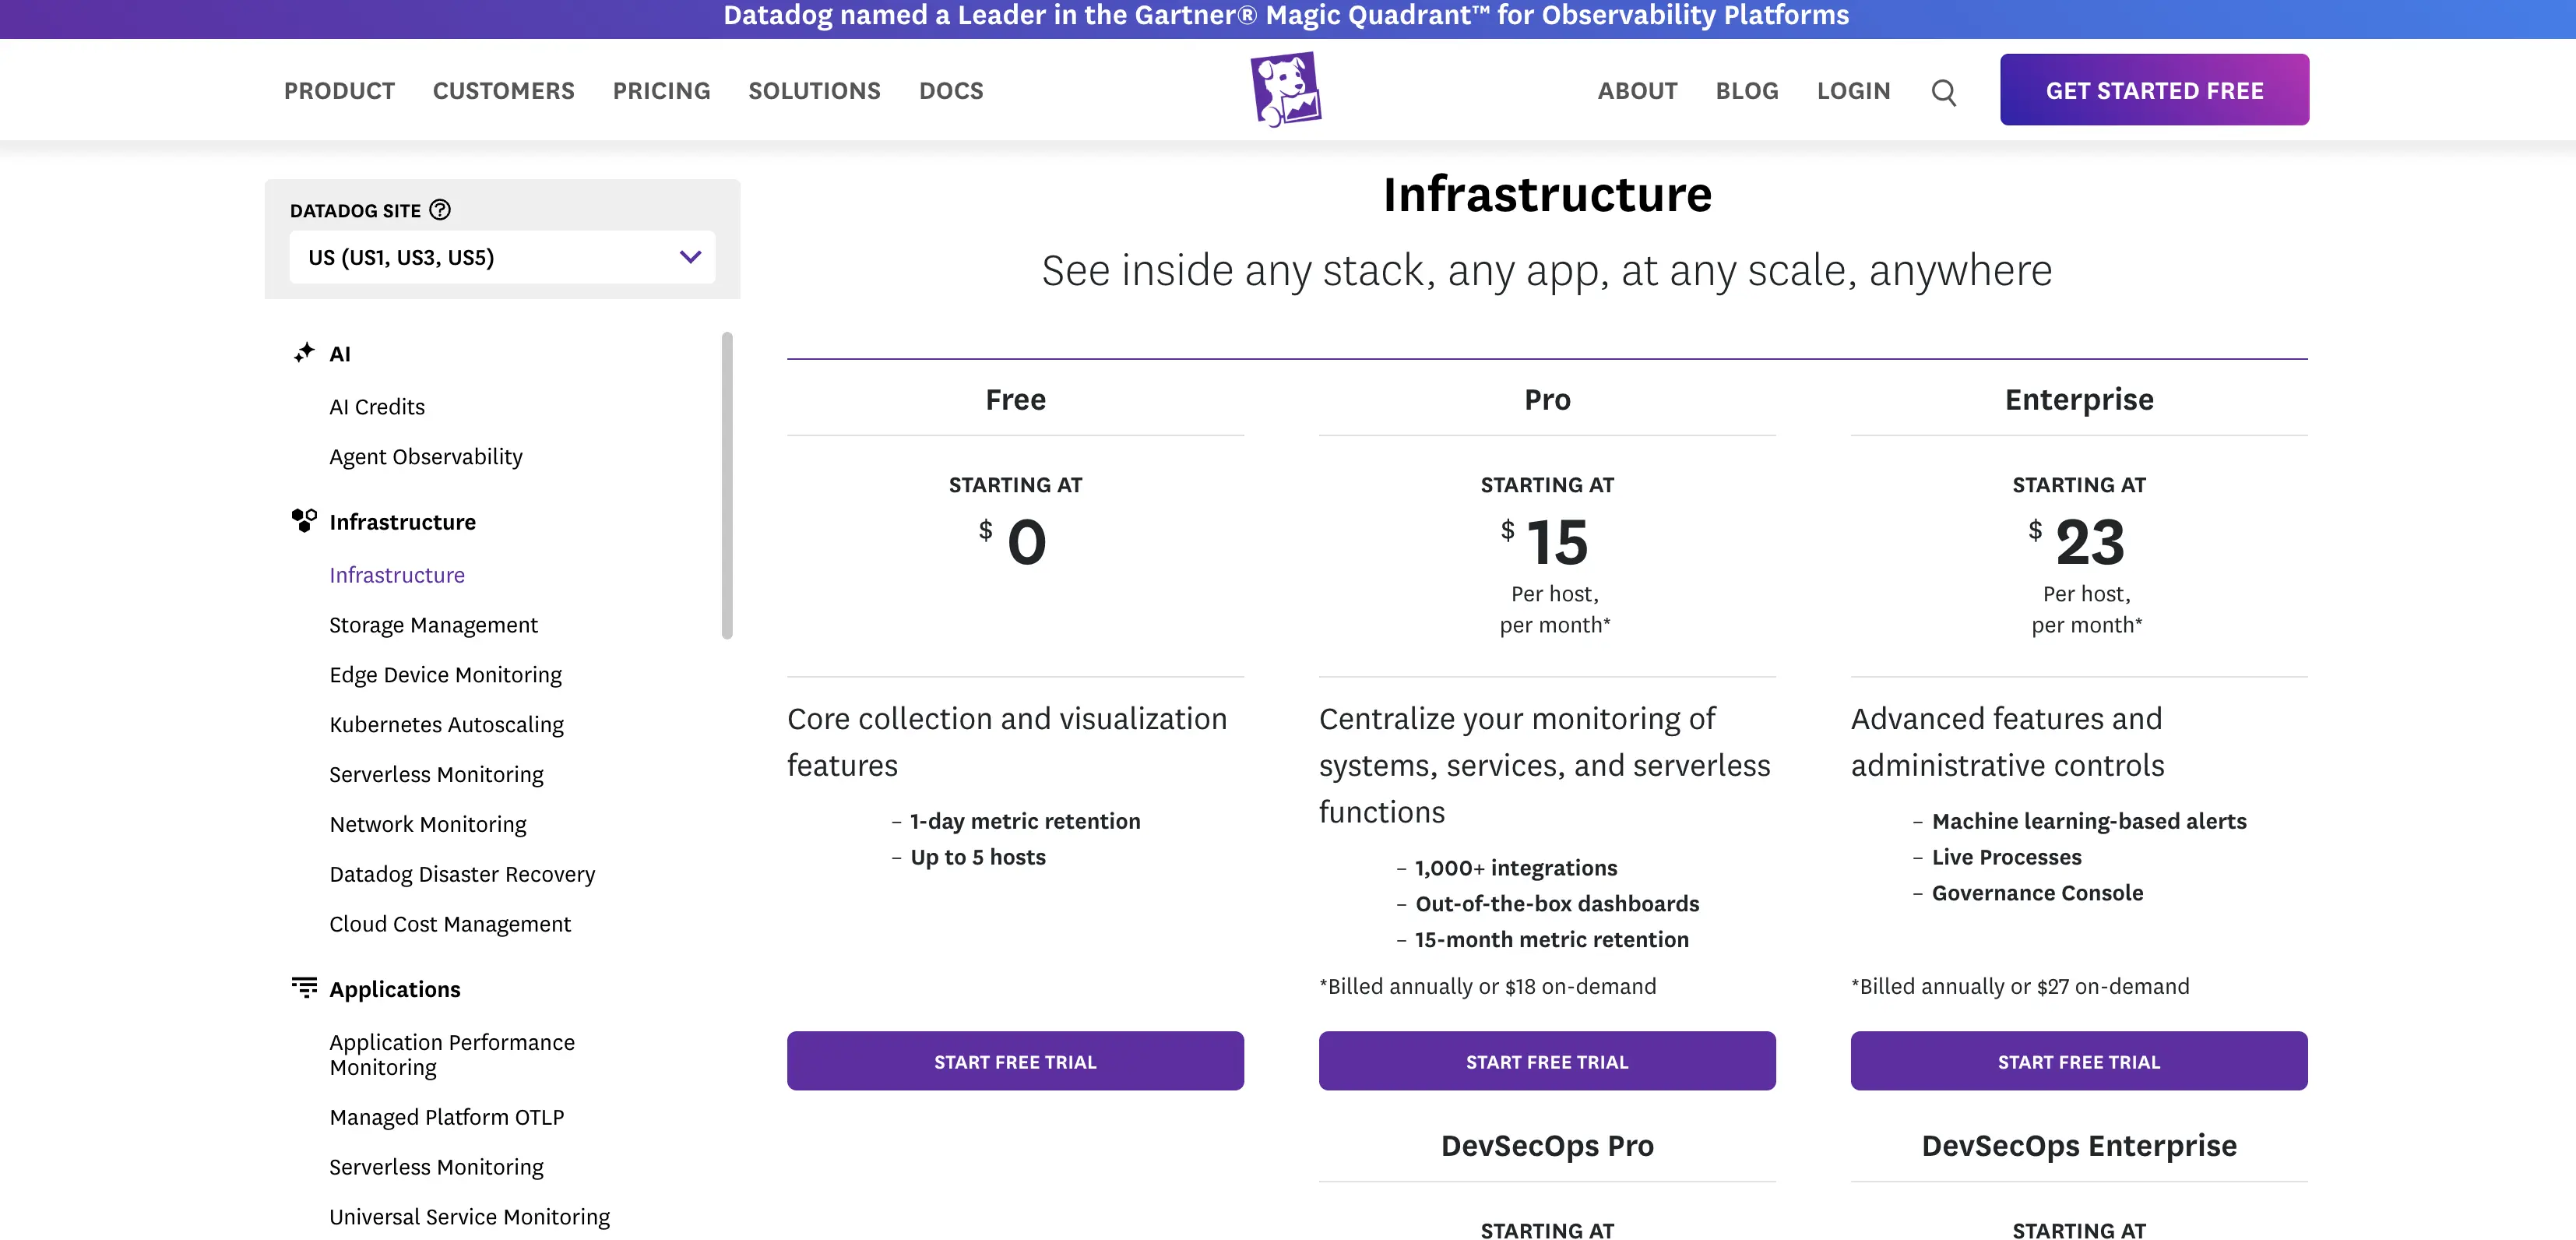
Datadog: Infrastructure Pro $15/host/month (annual), APM $31/host/month, logs $0.10/GB. Datadog is a commercial full stack monitoring platform that bundles infrastructure, APM, logs, and dozens of other modules under one login. Each module meters separately, so a small team running Infra Pro, APM, and moderate logging across 10 hosts commonly lands between $800 and $2,000 a month. It buys the widest integration library of anything here, at the highest starting cost.
New Relic: Free tier: 100GB of ingest a month forever, $0.30 to $0.40/GB after that New Relic is a commercial observability platform whose free tier includes 100GB of data ingest every month with no time limit and one full access user at no cost, more headroom than Grafana Cloud's free tier gives on logs or metrics before charges start. Past that 100GB, data is billed around $0.30 to $0.40 per GB depending on the type. For a small team that wants to try real production data without a card on file, it is the most generous door in on this list.
Dynatrace: Full-Stack Monitoring about $0.01/GiB-hour, Infrastructure about $29/host/month. Dynatrace is an AI driven enterprise observability platform that automatically discovers and maps your infrastructure instead of asking you to build dashboards by hand. Pricing runs on consumption: Full-Stack Monitoring works out to roughly $58 a month for an 8GiB host, and infrastructure-only monitoring runs about $29 per host per month. It is built for large, complex environments where automated root cause analysis saves more engineer time than it costs in licensing.
Splunk (Observability Cloud): Consumption based, commonly starting around $2,000/month. Splunk Observability Cloud is an enterprise platform for teams that already rely on Splunk for log analytics and security, keeping observability and SIEM data on one platform. Pricing is consumption based and commonly starts around $2,000 a month for the SaaS tier, well above anything else on this list. It suits a team already deep in the Splunk ecosystem far more than one starting from zero.
Honeycomb: Free up to 20 million events/month, Pro from $130 per 100 million events. Honeycomb is a trace-first observability platform built for teams debugging distributed systems by slicing high cardinality data (many unique label combinations, like per request IDs) on the fly rather than staring at pre-built dashboards. The free tier covers up to 20 million events a month, and Pro pricing starts at $130 per 100 million events past that. It fits engineers asking new questions of their data daily better than teams who mostly want the same dashboard to look the same way every morning.
Read Also: Zabbix alternatives: (Easier Setup, Less Upkeep, Cloud-Native)
Lightweight and niche picks
Better Stack: Free tier generous, Team from $29/month, telemetry bundles from $25/month. Better Stack combines uptime monitoring, log management, and incident response in one platform, with unlimited team members able to view telemetry instead of a per seat charge. The free tier alone includes 10 monitors, 3GB of logs, and 30GB of metrics a month, and the paid Team tier starts at $29 a month with telemetry bundles priced separately from $25 a month up. It suits a small team that wants uptime checks and on call paging bundled with the dashboards, not the dashboards alone.
Metabase: Free self hosted, Cloud Starter $100/month, Cloud Pro $575/month. Metabase is an open source business intelligence tool for building dashboards from business data with SQL or a visual query builder. The Open Source edition is free to self host, Cloud Starter runs $100 a month for 5 users, and Cloud Pro jumps to $575 a month once SSO and row-level permissions come into play. If nobody on the team has touched PromQL and the dashboards are for revenue, signups, or churn, Metabase does that job better than any tool built for server metrics.
How to pick Grafana Alternatives
If the complaint is too many moving parts, go with SigNoz or OpenObserve. Both replace the whole Loki, Tempo, Mimir chain with one binary.
If setup time is the actual problem, Netdata gets a working dashboard live in under a minute with zero configuration.
If the budget has to be fixed and predictable, Zabbix or a self-hosted Elastic stack cost nothing beyond servers you already run.
If the dashboards are for revenue and signups, not servers, Metabase handles that job better than any tool built for time series metrics.
If the team already pays for one big platform and wants fewer logins, Datadog or Dynatrace trade a higher bill for consolidation.
Grafana Alternatives Comparison Table
Tool | Deployment | Starting price | Free tier ceiling | Best for |
|---|---|---|---|---|
SigNoz | Self hosted or cloud | Free / $49 mo | Unlimited (self hosted) | Replacing the LGTM stack |
Elastic | Self hosted or cloud | Free / $99 mo | Unlimited (self hosted) | Teams already on Elasticsearch |
Zabbix | Self hosted | Free | Unlimited | Classic infrastructure monitoring |
Netdata | Agent based, cloud UI | Free / $4.50 per node | 5 nodes | Fastest setup |
OpenObserve | Self hosted or cloud | Free / $0.50 per GB | Unlimited (self hosted) | Object storage economics |
Parseable | Self hosted, BYOC, cloud | $0.39/GB | Varies | Log-heavy workloads |
Datadog | Cloud SaaS | $15/host mo | 5 hosts, 1 day retention | Widest integrations |
New Relic | Cloud SaaS | Free / usage | 100GB/mo forever | Generous free tier |
Dynatrace | Cloud SaaS | ~$0.01/GiB-hr | None published | Automated root cause analysis |
Splunk | Cloud SaaS | ~$2,000/mo | None | Existing Splunk shops |
Honeycomb | Cloud SaaS | Free / $130 per 100M events | 20M events/mo | High cardinality tracing |
Better Stack | Cloud SaaS | Free / $29 mo | 3GB logs, 30GB metrics | Uptime plus dashboards |
Metabase | Self hosted or cloud | Free / $100 mo | Unlimited (self hosted) | Business dashboards, not servers |
FAQ for Grafana Alternatives
Is there a free alternative to Grafana?
Yes. SigNoz, Zabbix, Netdata for up to 5 nodes, Elastic's core stack, and OpenObserve's self-hosted edition are all free with no forced paid tier, though each one still needs someone to run the servers.
What is the cheapest Grafana alternative for a small team?
Netdata's Business plan at $4.50 per node per month and Zabbix's free core software are the cheapest paid routes, while New Relic's 100GB free tier covers most small teams without a card on file at all.
Which Grafana alternative works best for Kubernetes monitoring?
SigNoz and OpenObserve, since both handle high cardinality Kubernetes metrics through native OpenTelemetry support without the cardinality limits Loki hits at scale.
Is Grafana actually more expensive than its alternatives?
Not always. At a 15,000-series metrics workload with a standard 30-second scrape interval, Grafana Cloud Pro runs about $51.50 a month, cheaper than SigNoz Cloud's roughly $129.60 a month once its included sample allowance runs out.
What should I use instead of Grafana for business dashboards, not servers?
Metabase, since it is built for querying business data with SQL or a visual builder rather than time series metrics from Prometheus.
Does Grafana still have a free on-call tool?
The open source Grafana OnCall project entered maintenance mode in March 2025 and was archived on March 24, 2026, so free self-hosted on-call routing through Grafana is no longer actively maintained.
Final thoughts on Grafana Alternatives
None of these 13 tools are a straight swap for Grafana, and that is sort of the point. Grafana never really competed on price. It competed on being the one dashboard layer that could sit on top of almost anything you threw at it. If the real complaint is the LGTM stack's operational weight, SigNoz or OpenObserve solve that directly. If the complaint is cost at your specific series count, run the math the way we did above instead of trusting a marketing page that says a big percentage cheaper without showing the workload it is cheaper for.