
A $21 Microsoft 365 Copilot Business seat pays for itself if it saves an office worker about 8 minutes a week.
A $195 Salesforce Sales Cloud Core seat needs roughly 75 minutes a week from every sales rep before the time it saves pays the bill.
That gap is what the saasswitcher saas roi calculator measures.
You enter seats, the price per seat, the hours a tool saves each person, and what an hour of their time costs, and it returns an ROI percentage, net value per year and hours saved per year.
Four real tools are run through it below, using vendor prices checked on 29 September 2026 and hourly costs published by the US Bureau of Labor Statistics.
Nothing here is hypothetical except the hours, and each example says where its hours figure comes from.
How to calculate SaaS ROI with this calculator
Six inputs feed the result. Each one maps to a single line of math.
Input | What to enter | How the calculator uses it |
|---|---|---|
Users / seats | Paid seats you plan to buy | Multiplies both the cost and the time saved |
Cost / seat | The vendor's list price per seat | Read as a monthly price, or divided by 12 on Yearly Pricing |
Monthly Pricing or Yearly Pricing | How the vendor bills | Yearly turns an annual seat price into a monthly cost |
Hours saved per user / week | 0 to 20, in half hour steps | Converted to monthly hours at 4.33 weeks a month |
Avg hourly rate | Fully loaded cost of one hour | Turns hours into dollars |
Extra revenue / mo | Optional added gross profit | Added straight onto monthly value |
The SaaS ROI formula behind the headline number runs in four steps:
Monthly cost = seats × cost per seat (divided by 12 on Yearly Pricing).
Monthly value = seats × hours saved per week × 4.33 × hourly rate, plus extra revenue.
ROI % = (monthly value minus monthly cost) ÷ monthly cost × 100.
Net value per year = (monthly value minus monthly cost) × 12.
Nothing else goes in. The default screen shows how it fits together. Ten seats at $15 cost $150 a month, while two hours a week per person at $40 an hour works out to 10 × 2 × 4.33 × $40, or $3,464 a month in recovered time.
Net value is $3,314 a month. ROI reads 2,209%, and the line underneath says 23.1× return on every $1 spent.
The label above the percentage follows fixed bands: anything below 0% shows Negative ROI, 0% up to 199% shows Positive ROI, and 200% or higher shows Excellent ROI.
The currency menu (USD, EUR, GBP, INR, AUD, CAD) swaps the symbol only and applies no exchange rate, so enter prices and hourly costs in whichever currency you pick. Inputs are saved in your browser between visits.
Which hourly rate to use
Salary alone undercounts. The Bureau of Labor Statistics Employer Costs for Employee Compensation release for June 2026 puts total compensation for private industry workers at $46.89 per hour worked, of which wages are $32.82 and benefits are $14.07, a 30.0% share. Use the total.
A seat that saves an hour saves the benefits cost of that hour as well as the paycheck, which is why the rate field asks for a fully loaded figure.
The same release breaks the figure down by occupation. These rows come from Table 4, private industry, total compensation per hour worked:
Occupation group | Cost per hour worked (June 2026) |
|---|---|
Management, business and financial | $88.63 |
Professional and related | $73.69 |
All private industry workers | $46.89 |
Office and administrative support | $36.73 |
Sales and related | $35.85 |
Service | $23.73 |
Pick the row closest to the people who will use the seats. If you have your own payroll and benefits cost per hour, use that instead, since it will describe your team better than a national average ever can. BLS is the fallback.
Four real SaaS ROI examples calculated using SaaSSwitcher SaaS ROI Calculator
Every price below was read off the vendor's own pricing page on 29 September 2026, and every hourly rate comes from the BLS table above.
The hours input is the only assumption in each example, which also makes it the input most worth questioning before you trust a result.
The rest is published.
Example 1: Microsoft 365 Copilot Business for a 10 person office team
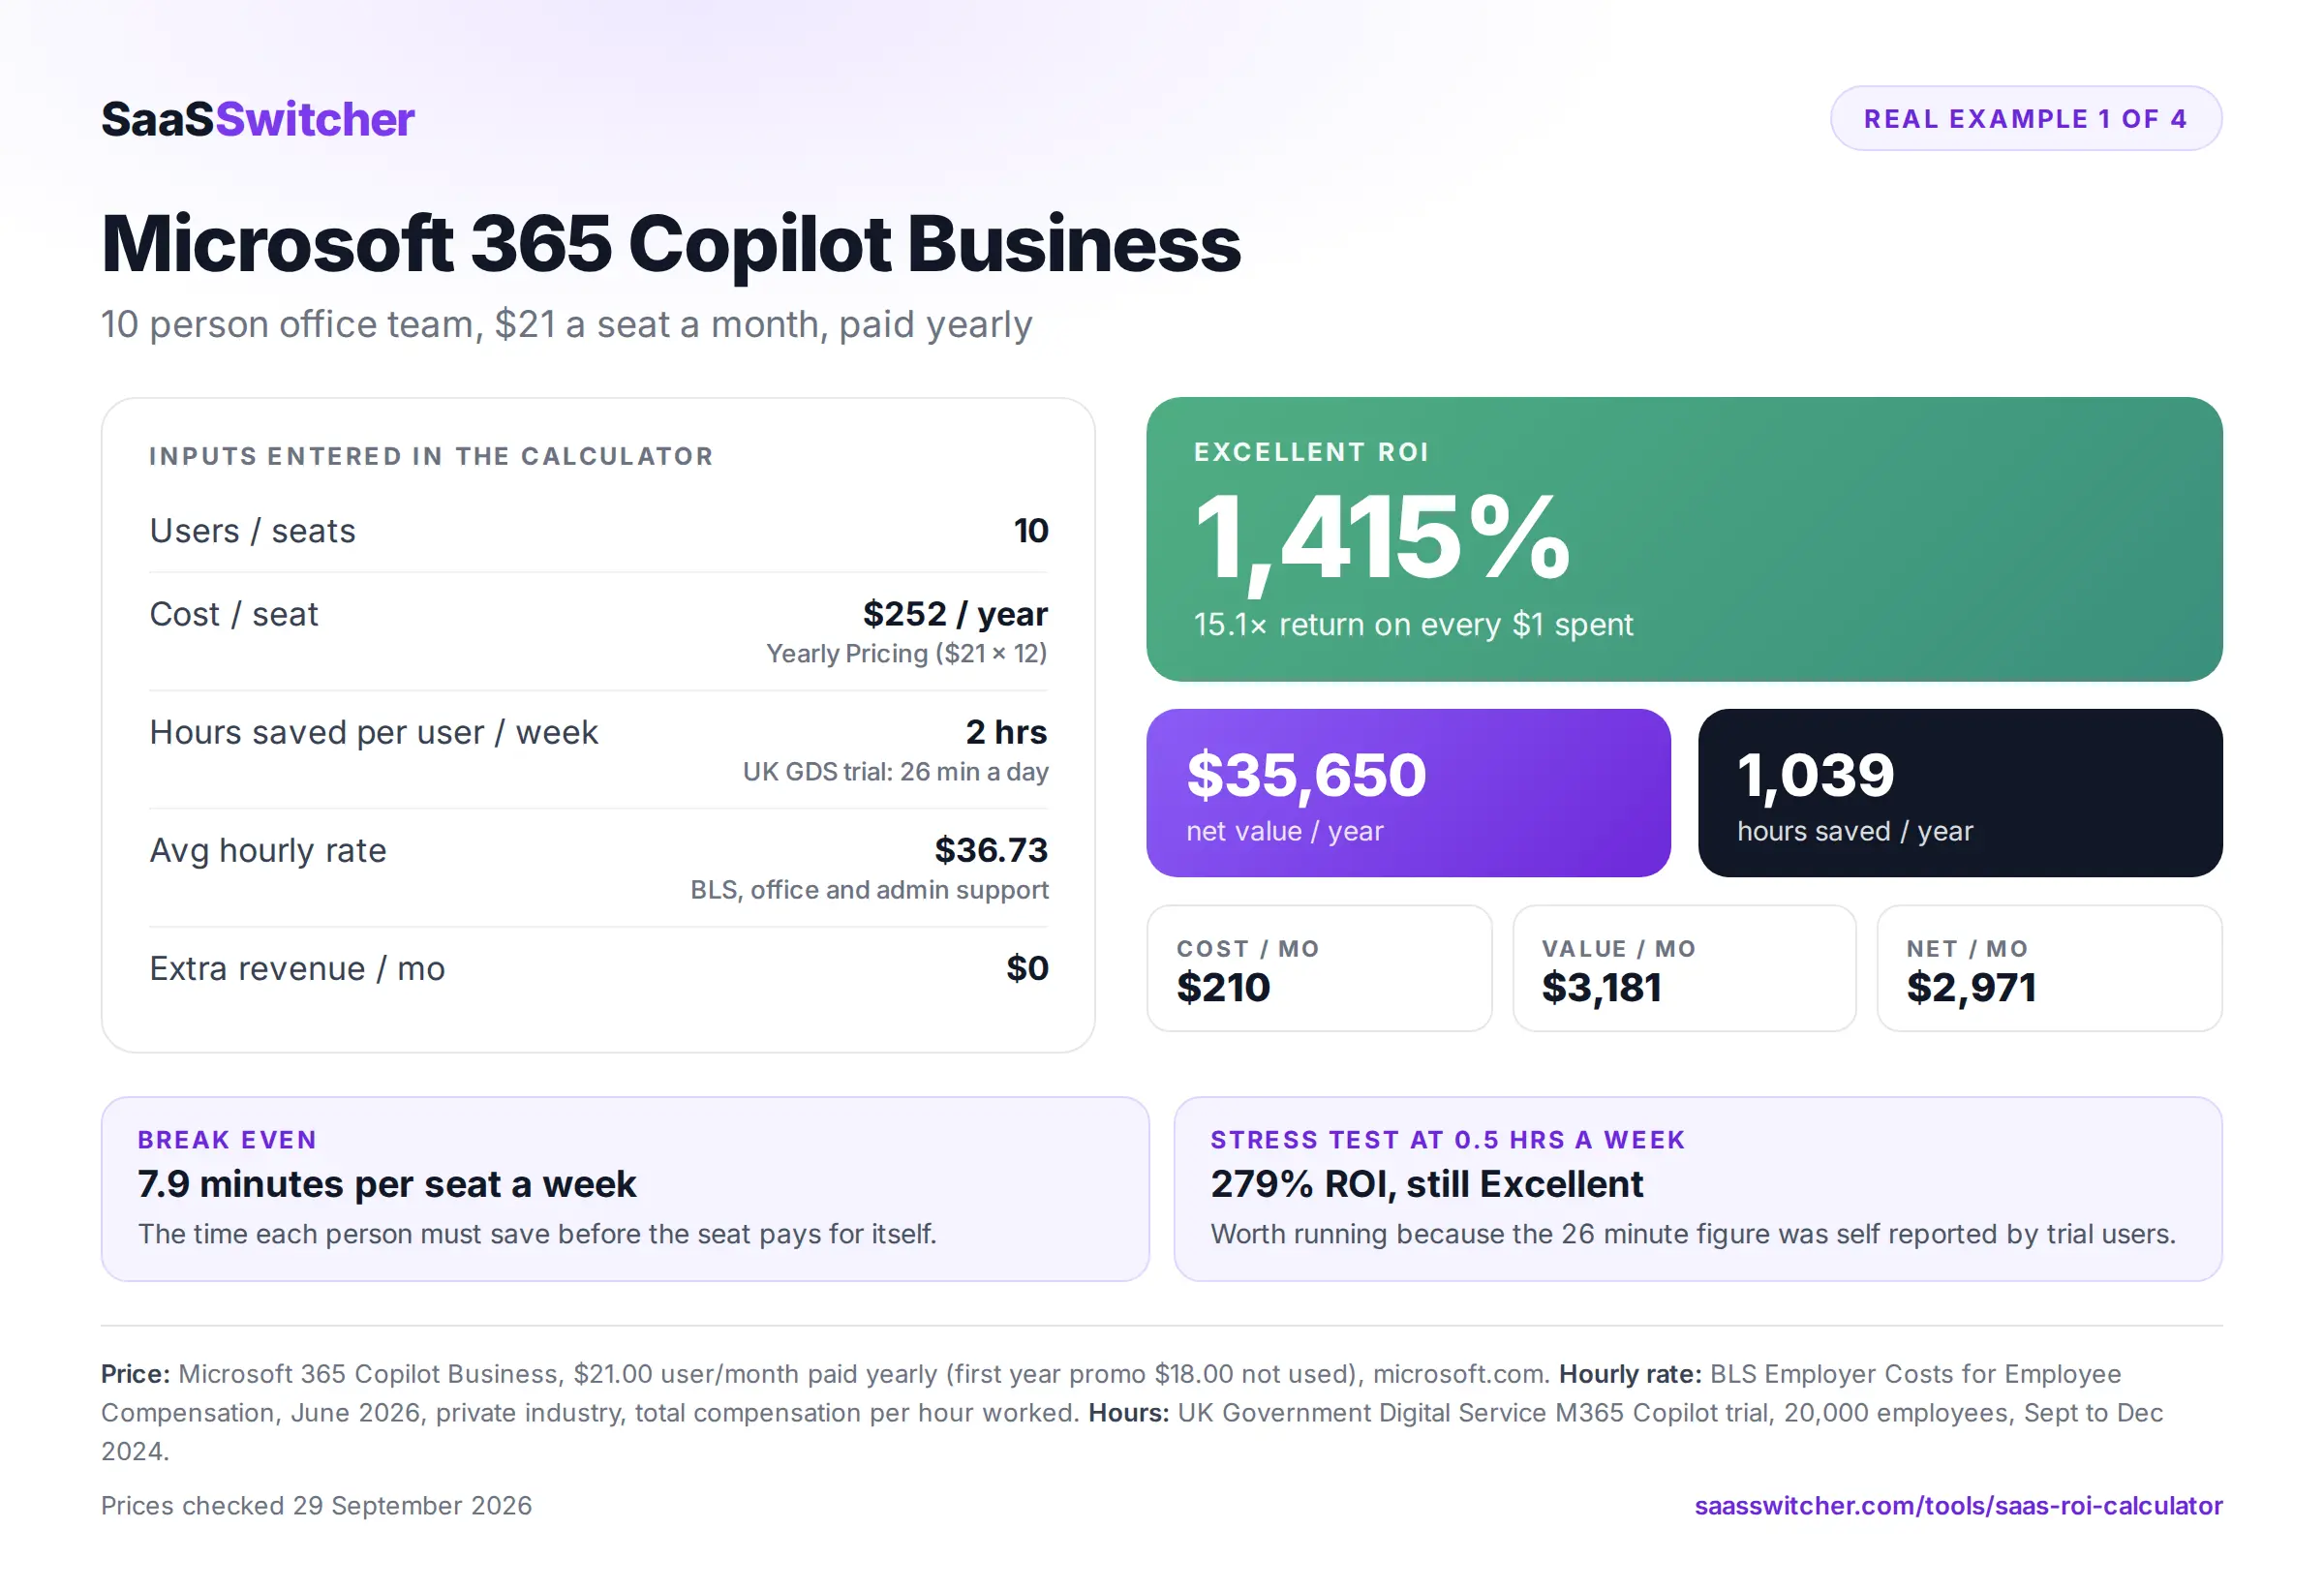
Microsoft's business pricing page for Copilot lists Microsoft 365 Copilot Business at $21.00 per user a month, paid yearly.
A promotional $18.00 runs from 1 July to 31 December 2026 for existing customers on an eligible Microsoft 365 Business plan, and it applies to the first year only.
The example uses $21. That is the renewal price. Copilot Business is sold as an add on to Microsoft 365 Business subscriptions, so the ROI below covers the Copilot cost only and assumes the team already pays for Microsoft 365.
Input | Value |
|---|---|
Users / seats | 10 |
Cost / seat | $252 a year, Yearly Pricing |
Hours saved per user / week | 2 |
Avg hourly rate | $36.73 (BLS office and administrative support) |
Extra revenue / mo | $0 |
The calculator returns Excellent ROI at 1,415%, with $35,650 of net value a year and 1,039 hours saved a year against a $210 monthly bill.
The 2 hours come from the UK Government Digital Service trial, which involved 20,000 government employees from 30 September to 31 December 2024. Its cross government findings report states: "Trial participants saved an average of 26 minutes a day when using M365 Copilot." Five working days at 26 minutes is about 2.2 hours a week.
That number came from participants describing their own time savings in a survey. Treat it with care.
The Department for Business and Trade, which held 1,000 licences in that trial, published a separate evaluation and found no solid evidence that the time saved was turning into higher productivity, while noting that productivity was not a main aim of its study. It found time savings on tasks such as drafting documents, summarising research, transcribing meetings and searching for information, while scheduling and building PowerPoint decks saved no time at all.
A Hacker News discussion of the DBT findings drew 60 points and 13 comments, and one commenter found it good at summarising missed meetings but said asking it to rephrase a sentence did not save them any time.
So run it again at half an hour a week. ROI falls to 279% and still reads Excellent. Both runs pass.
Break even sits at 7.9 minutes per person per week, which means the price is rarely the problem with Copilot Business; the open question is whether your team spends its week on the tasks where the savings showed up.
Example 2: Salesforce Sales Cloud Core for five sales reps
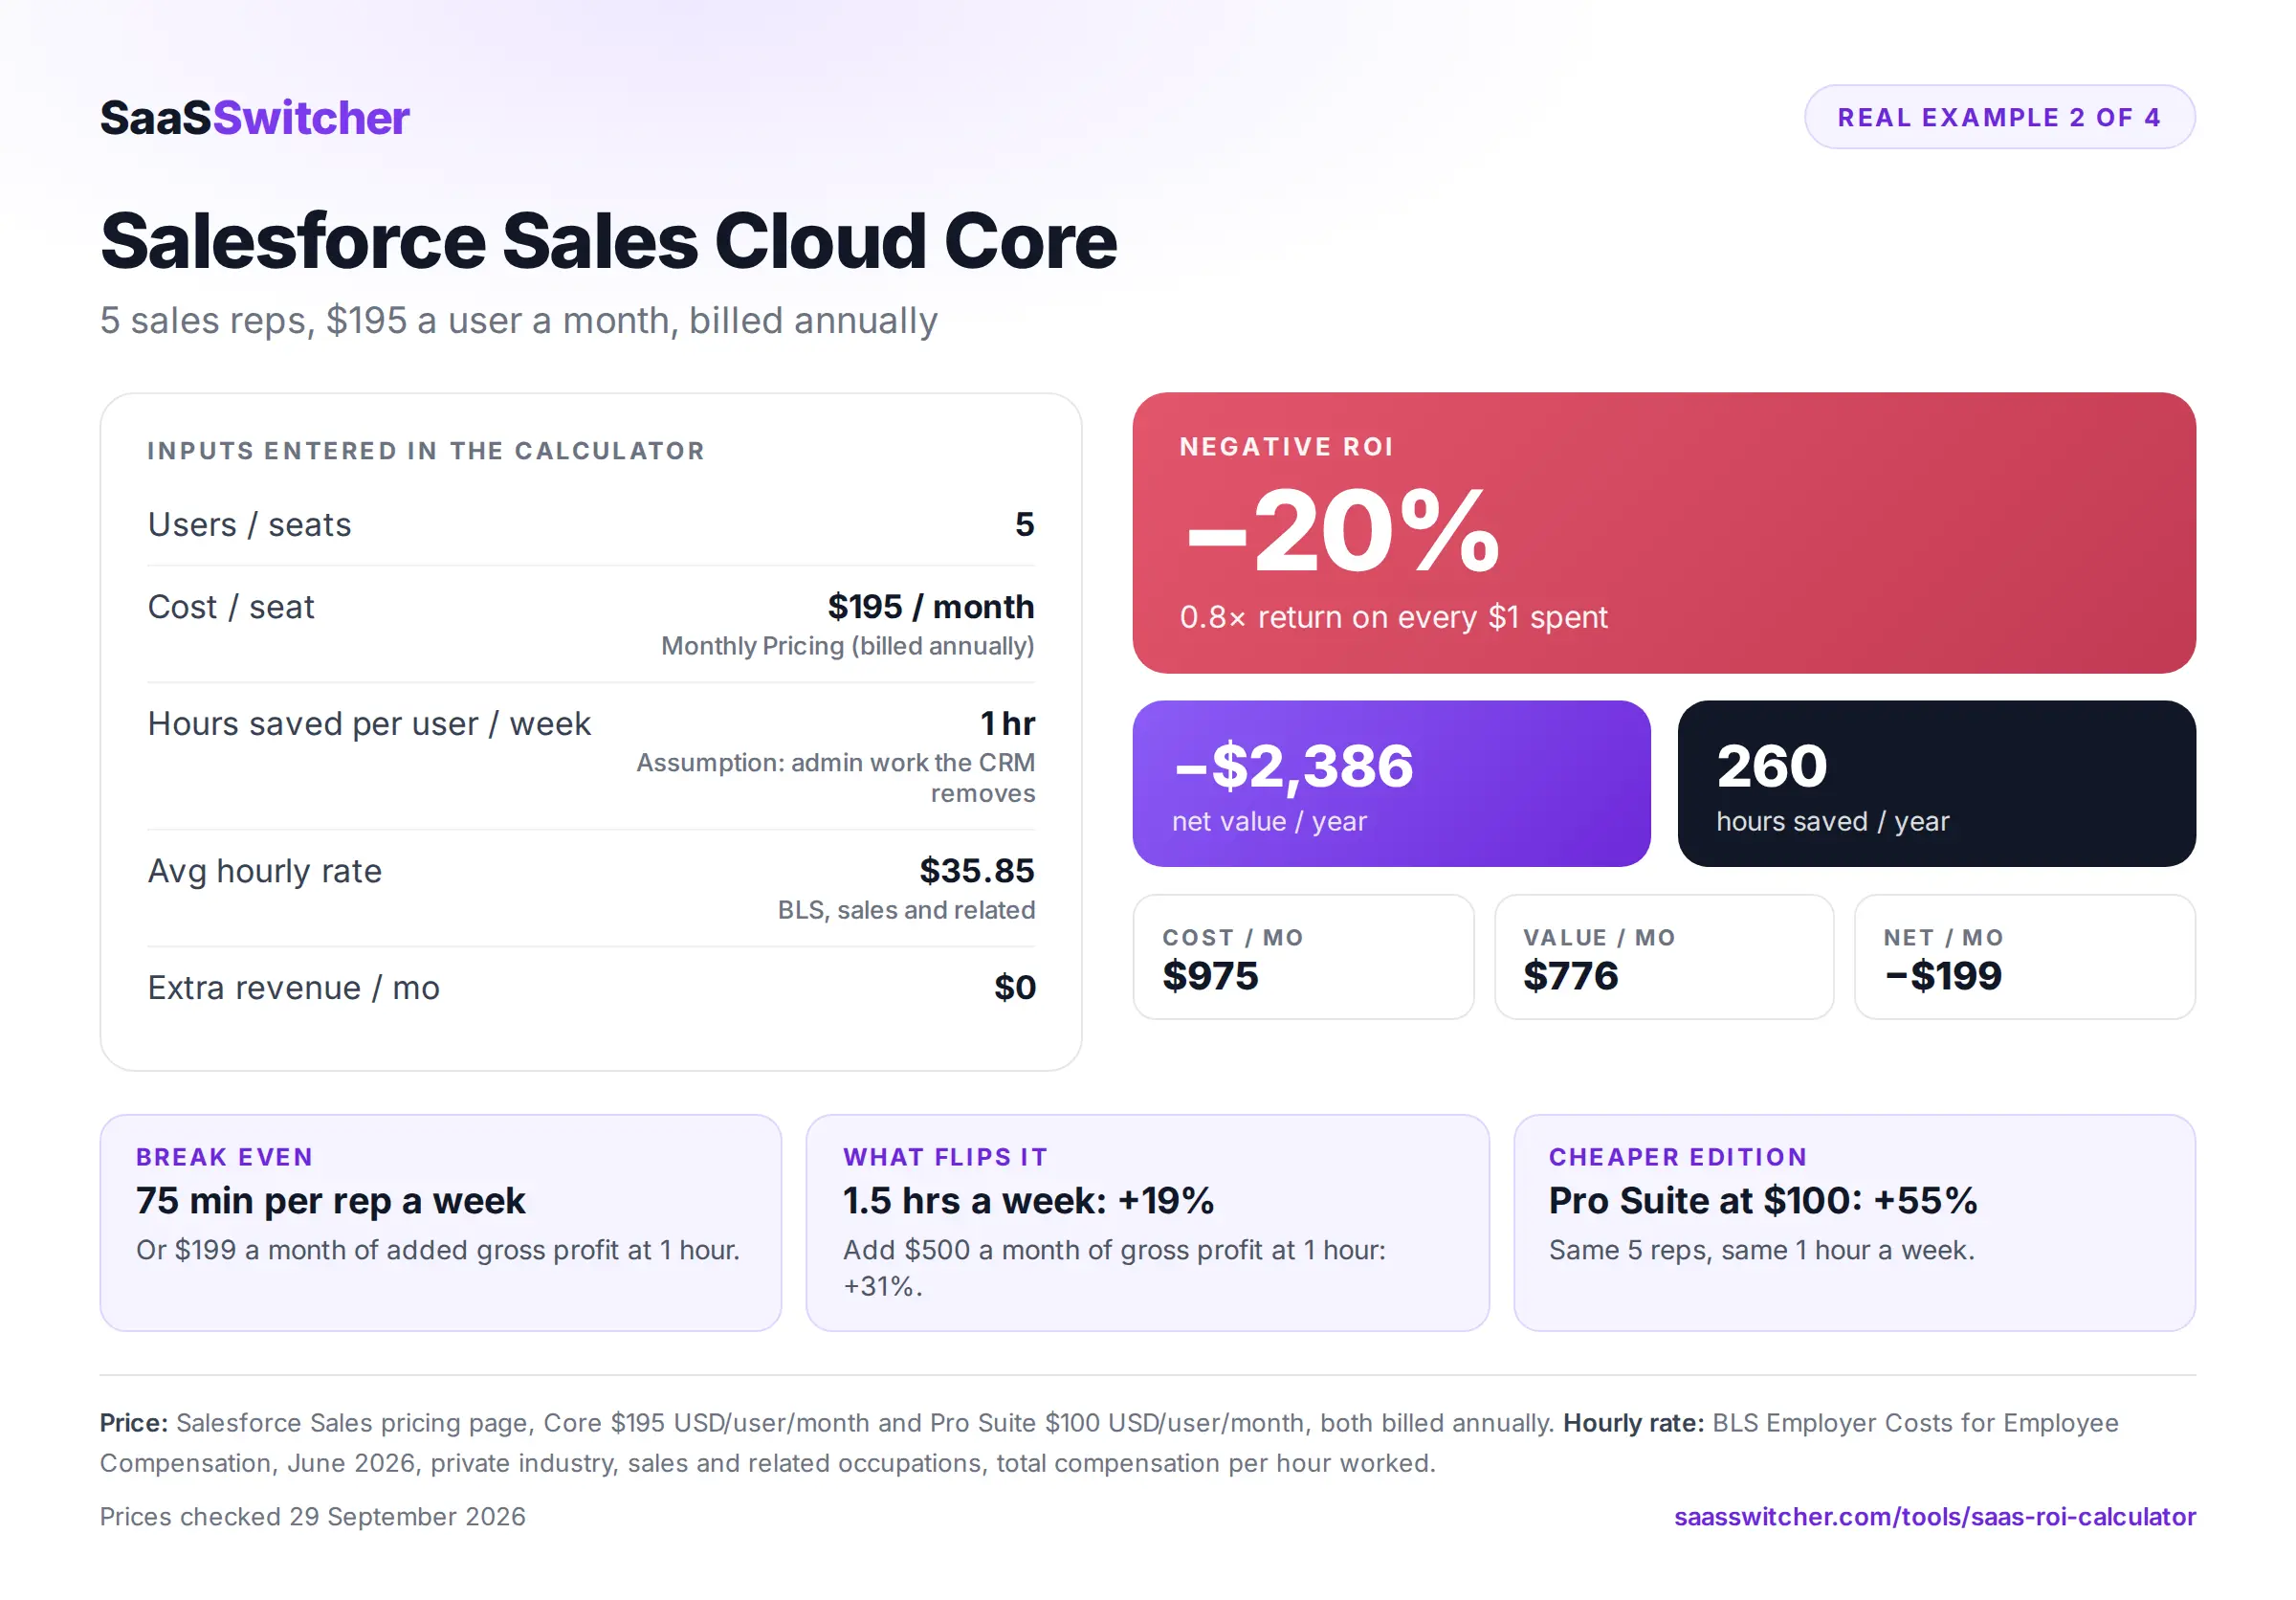
Salesforce's Sales pricing page lists Core at $195 per user a month, billed annually, with Pro Suite one step below at $100.
Input | Value |
|---|---|
Users / seats | 5 |
Cost / seat | $195 a month, Monthly Pricing (billed annually) |
Hours saved per user / week | 1 |
Avg hourly rate | $35.85 (BLS sales and related) |
Extra revenue / mo | $0 |
The 1 hour is an assumption covering the admin a CRM takes off a rep's plate, such as logging calls, updating deal stages and sending follow up emails by hand.
This one loses money. Negative ROI, minus 20%: the team pays $975 a month and gets $776 of time back, a loss of about $2,386 a year.
Core needs 1.26 hours per rep per week to break even, roughly 75 minutes. Moving the slider to 1.5 hours gets there with a 19% return.
Pro Suite behaves differently.
Keep the slider at 1 hour and swap in Pro Suite at $100, and the same team shows Positive ROI of 55%, so the extra $95 a seat for Core has to be earned by what Core adds on top, which Salesforce lists as AI, Slack, Tableau and Agentforce skills.
The full edition breakdown sits in Salesforce pricing, and the CRM pricing comparison lines Salesforce up against five other CRM vendors.
The extra revenue field is where a sales tool can justify itself. At 1 hour a week, the team needs $199 a month of added gross profit to break even, and entering $500 lifts the result to 31%.
Enter gross profit here. A $5,000 deal at a 40% margin adds $2,000 of value, and typing the full $5,000 inflates that part of the result two and a half times.
Example 3: Zapier Professional for one operations person (flat price tool)
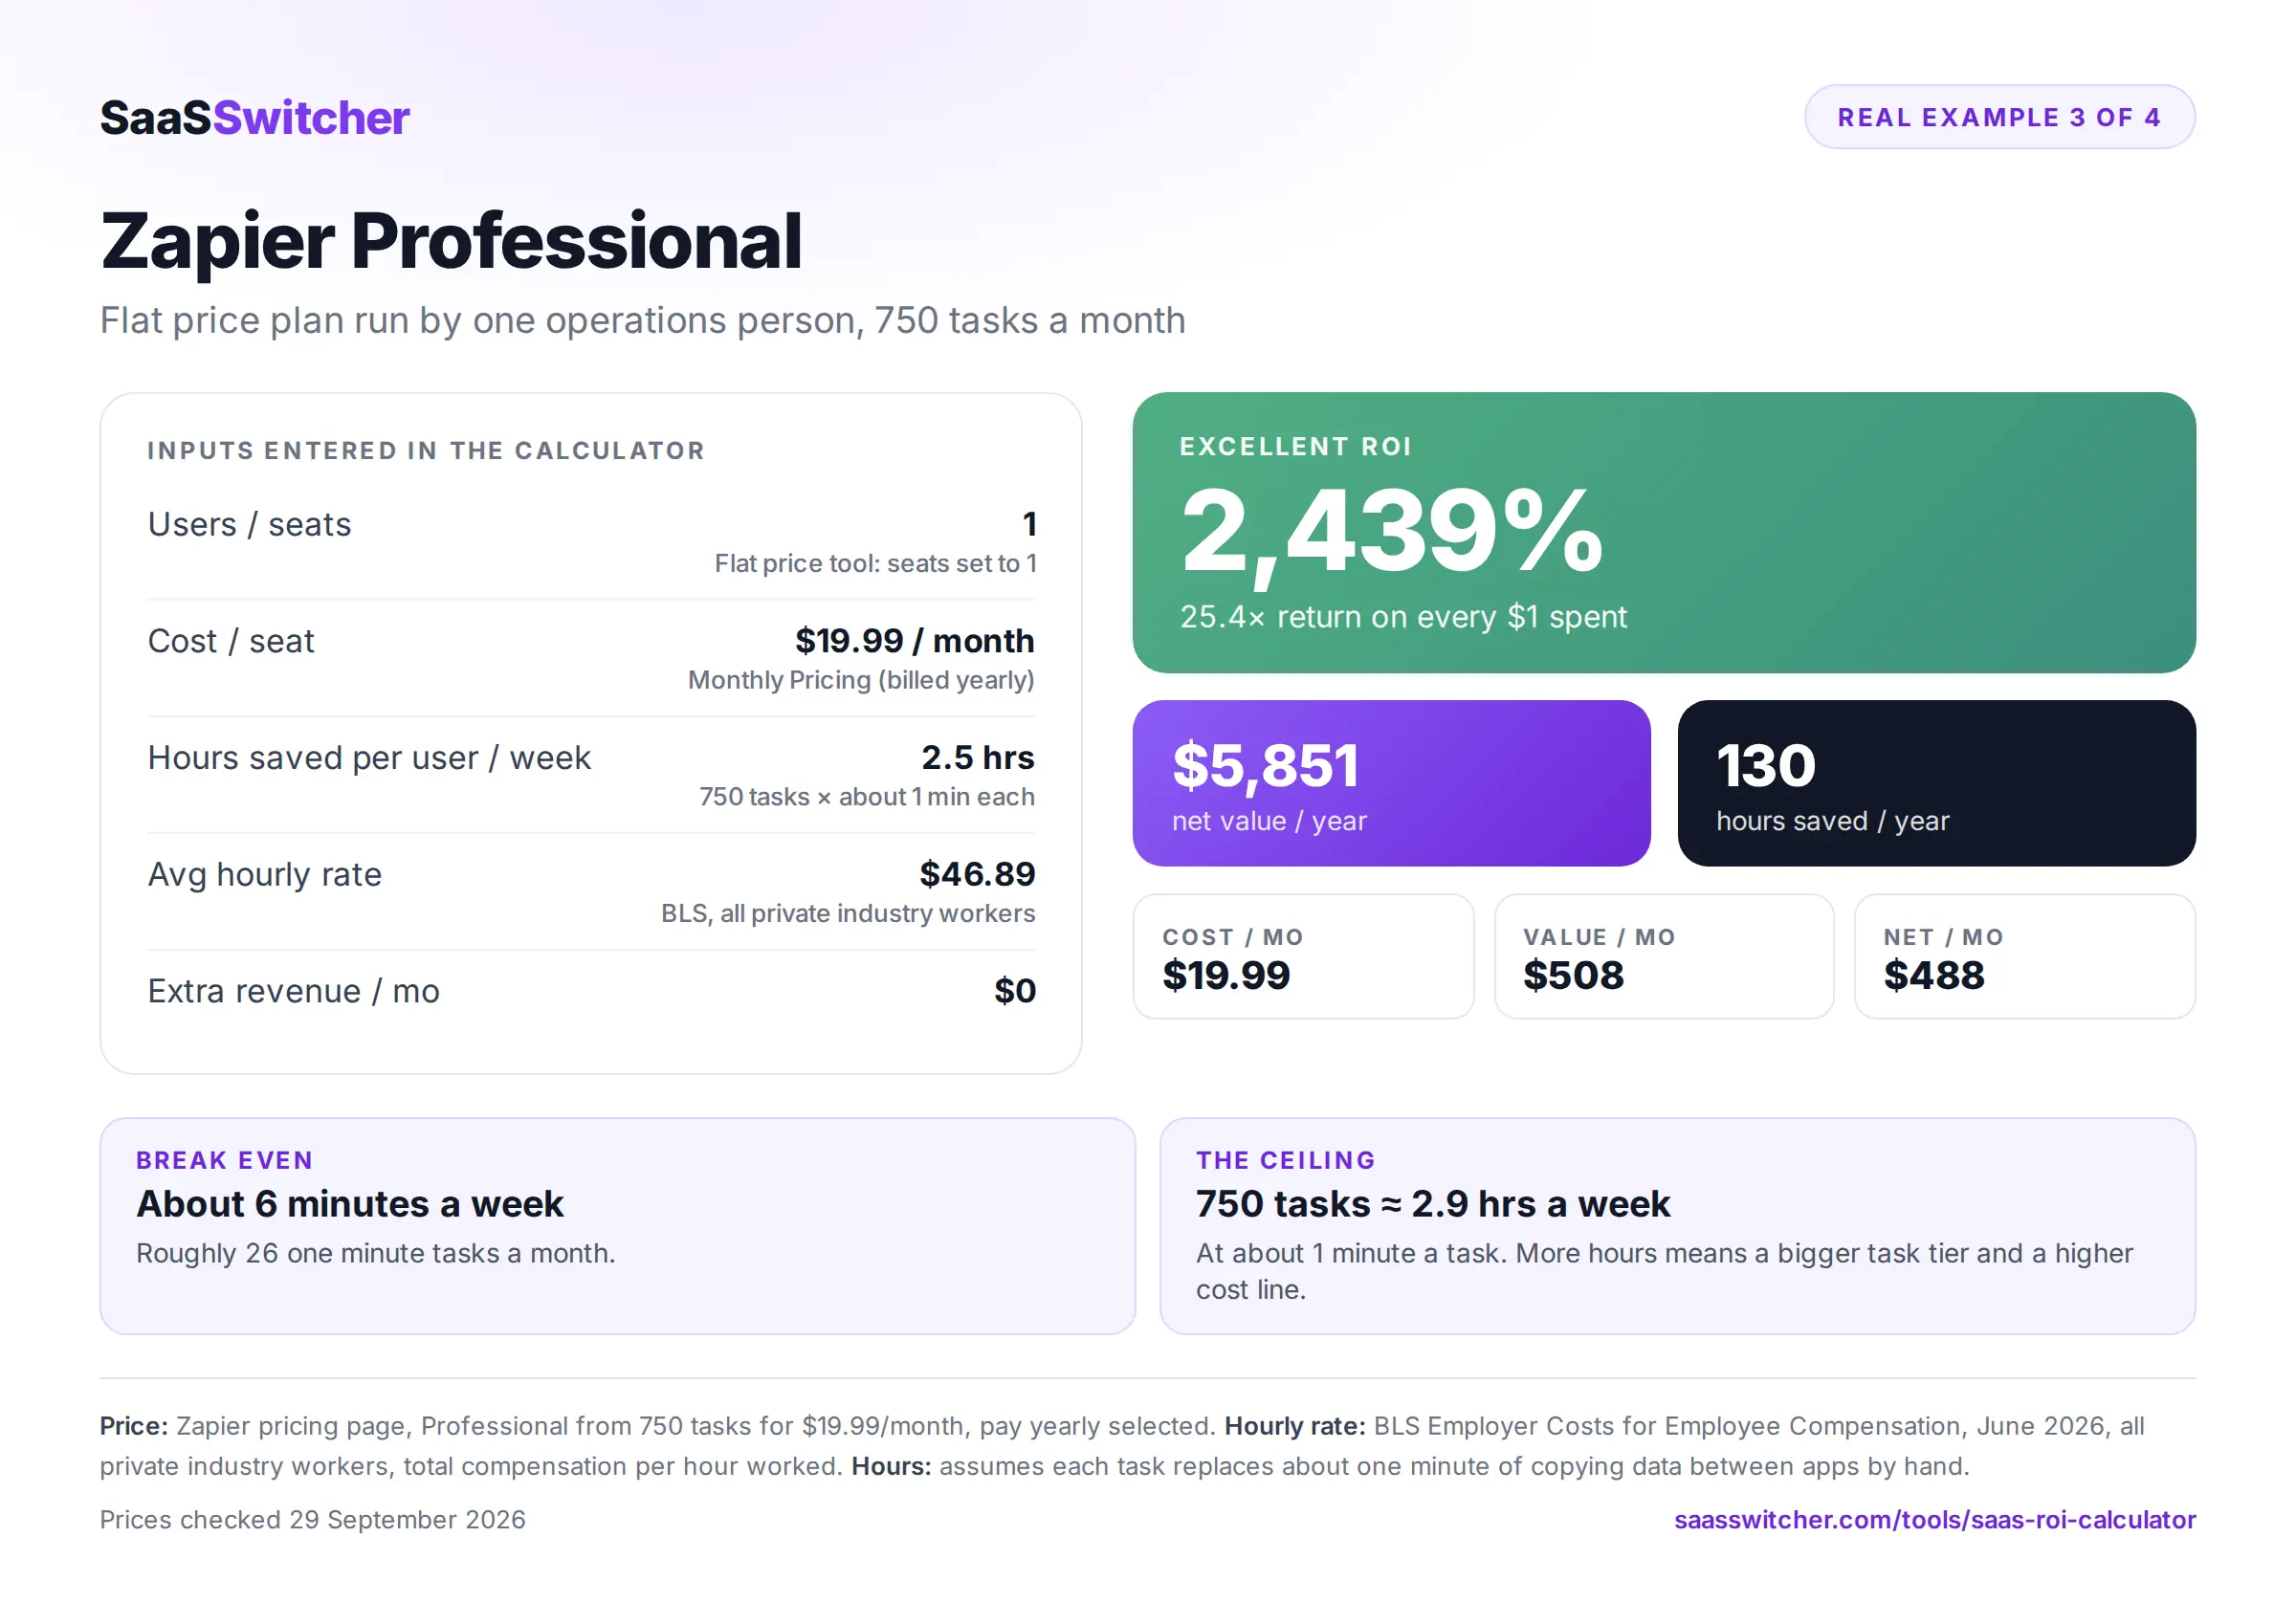
Some tools don't charge per seat. Zapier's pricing page lists Professional starting at 750 tasks for $19.99 a month, billed yearly.
For a flat price tool, set seats to 1, enter the whole plan price as the cost and put the total weekly hours saved across everyone into the hours slider.
Input | Value |
|---|---|
Users / seats | 1 |
Cost / seat | $19.99 a month, Monthly Pricing (billed yearly) |
Hours saved per user / week | 2.5 |
Avg hourly rate | $46.89 (BLS all private industry workers) |
Extra revenue / mo | $0 |
The hours come from the plan's own limit. If each of the 750 monthly tasks replaces about a minute of copying data between apps by hand, that is 12.5 hours a month, or 2.9 hours a week, entered as 2.5 to stay under what the plan can deliver.
Result: Excellent ROI at 2,439%, $5,851 of net value a year and 130 hours saved a year. Break even is about 6 minutes a week, or roughly 26 one minute tasks a month.
The task allowance is the real ceiling here, since claiming more hours than 750 tasks can cover means buying a larger task tier, and that raises the cost line.
The Zapier alternatives guide runs the task pricing math across other automation tools.
Example 4: Calendly Standard for a solo consultant, monthly or yearly billing
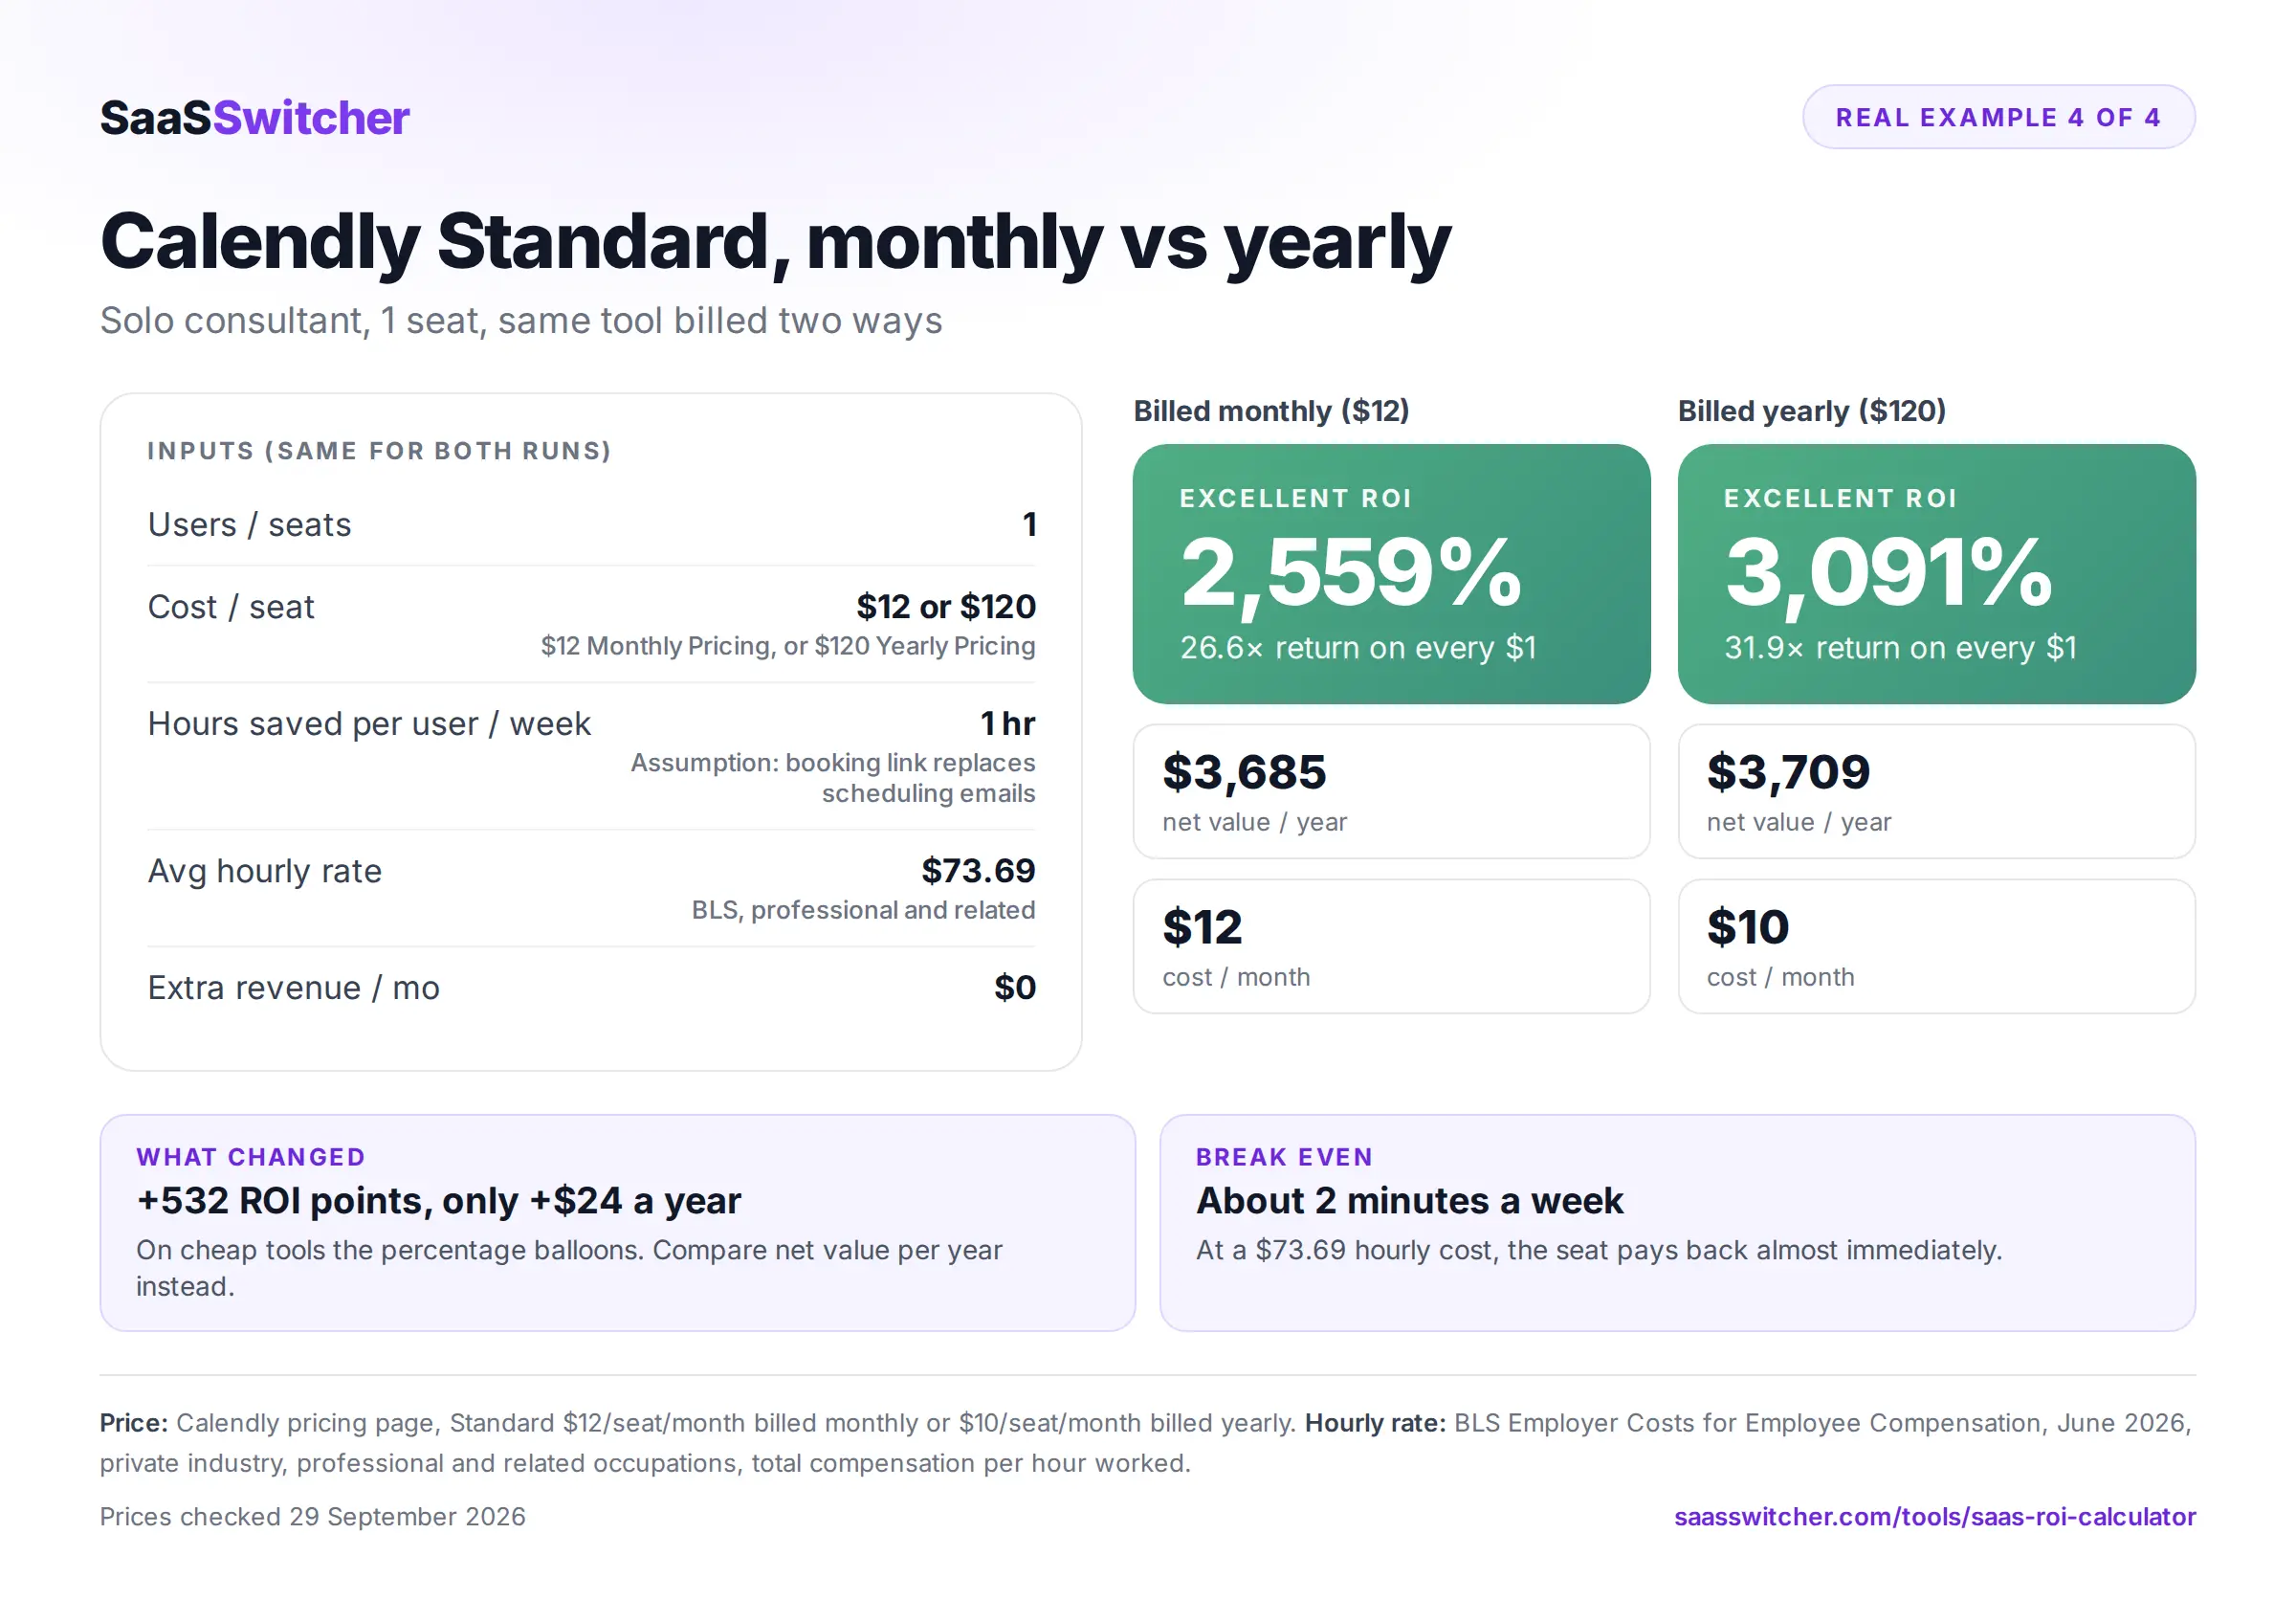
Calendly's pricing page lists Standard at $12 a seat a month billed monthly, or $10 billed yearly.
Input | Monthly billing | Yearly billing |
|---|---|---|
Users / seats | 1 | 1 |
Cost / seat | $12, Monthly Pricing | $120, Yearly Pricing |
Hours saved per user / week | 1 | 1 |
Avg hourly rate | $73.69 (BLS professional and related) | $73.69 |
Extra revenue / mo | $0 | $0 |
The hour assumes a booking link replaces the back and forth emails a consultant sends to set up calls each week.
Monthly billing returns 2,559% and yearly billing returns 3,091%, a jump of 532 points. Net value per year moves from $3,685 to $3,709. That is a $24 difference. The ROI figure misleads here.
On a cheap tool the percentage grows so large it stops telling you much, so compare net value per year and break even minutes (about 2 minutes a week here) instead.
The billing decision itself belongs in the annual vs monthly calculator, which weighs the saving against the commitment.
Break even minutes per seat per week
Price sets the bar. The fastest way to sanity check a tool before you open the calculator is to know how many minutes a seat has to save each week just to cover its price.
The table below applies the calculator's own formula (price ÷ (4.33 × hourly rate) × 60) to five common seat prices and five BLS hourly costs.
Seat price per month | Sales ($35.85) | Office ($36.73) | All private ($46.89) | Professional ($73.69) | Management ($88.63) |
|---|---|---|---|---|---|
$10 | 4 min | 4 min | 3 min | 2 min | 2 min |
$21 | 8 min | 8 min | 6 min | 4 min | 3 min |
$50 | 19 min | 19 min | 15 min | 9 min | 8 min |
$100 | 39 min | 38 min | 30 min | 19 min | 16 min |
$195 | 75 min | 74 min | 58 min | 37 min | 31 min |
Anything under 10 minutes a week is a low bar for a tool people open daily. Above 30 minutes, the hours estimate starts carrying the whole decision, and it deserves a second look.
Where a SaaS ROI result can mislead
The hours are the soft input. Most published time savings, including the 26 minute figure above, come from users describing their own experience.
Run the calculator twice, once at your estimate and once at half of it, and buy with confidence only if both clear break even.
Revenue means gross profit. The calculator adds the extra revenue field straight onto value, so booking value or top line sales will overstate the return.
One time costs have no field. Spread setup, migration or onboarding fees across the first year and add them to the cost per seat: a $1,200 setup fee over 12 months across 5 seats adds $20 a seat a month.
Unused seats still bill. If 3 of 10 people won't touch the tool, the average hours saved across all 10 seats is 30% lower than what the active users report, and that lower average is the one to enter.
Introductory prices expire. Model the renewal price, as Example 1 does with Copilot's $21 list price instead of the first year $18 offer.
SaaS ROI calculator FAQ
How do you calculate SaaS ROI?
Subtract the monthly cost from the monthly value, divide by the monthly cost and multiply by 100. Monthly value is seats × hours saved per week × 4.33 × hourly cost, plus any extra gross profit the tool brings in.
What is a good ROI for a SaaS tool?
The calculator labels 200% and above as Excellent. Per-seat tools priced at $25 a month or less reach it with under 30 minutes a week saved at the sales, office or higher BLS rates, so a more useful test is whether the tool still breaks even when you halve your hours estimate.
Should the hourly rate be salary or fully loaded cost?
Use fully loaded cost. BLS data for June 2026 shows benefits make up 30.0% of private industry compensation, so a wage only rate of $32.82 would undervalue every saved hour against the $46.89 total.
How do I enter a tool with a flat monthly price?
Set seats to 1, enter the full plan price as the cost per seat, and add up the weekly hours it saves across the whole team for the hours slider.
Example 3 shows this with Zapier Professional.
Does the currency selector convert prices?
No. It changes the symbol on every result and applies no exchange rate, so the numbers you type should already be in the currency you select.
Before you buy the next seat
Start with break-even, then the hours. If a tool clears break-even at half your hours estimate with the extra revenue field left at zero, it is safe on time alone.
If it only works at your full estimate, or only once revenue is added, compare cheaper options with the switch and save calculator, and check what your whole stack already costs with the SaaS spend calculator before adding another line to it.